Art
I love making pretty plots. Here’s a (disordered) collection of visualization I’ve made that I’m proud of enough to put on here.
The rising thermal bubble
This is a classic test case for fluid simulations. My code uses a well-balanced finite volume scheme to simulate Euler equations with gravity to get this visualization.
The double periodic steady-state in the Kasimov Equation
This is one of the best papers I have read. The authors describe a beautifully simple model for shockwave chaos. The shock wave goes from constant to periodic to double periodic to chaotic as a single parameter changes. It inspired me to recreate the simulations using finite volume solvers in Clawpack.
The chaotic case can be seen [here[(https://www.youtube.com/watch?v=BFadoM801yg).
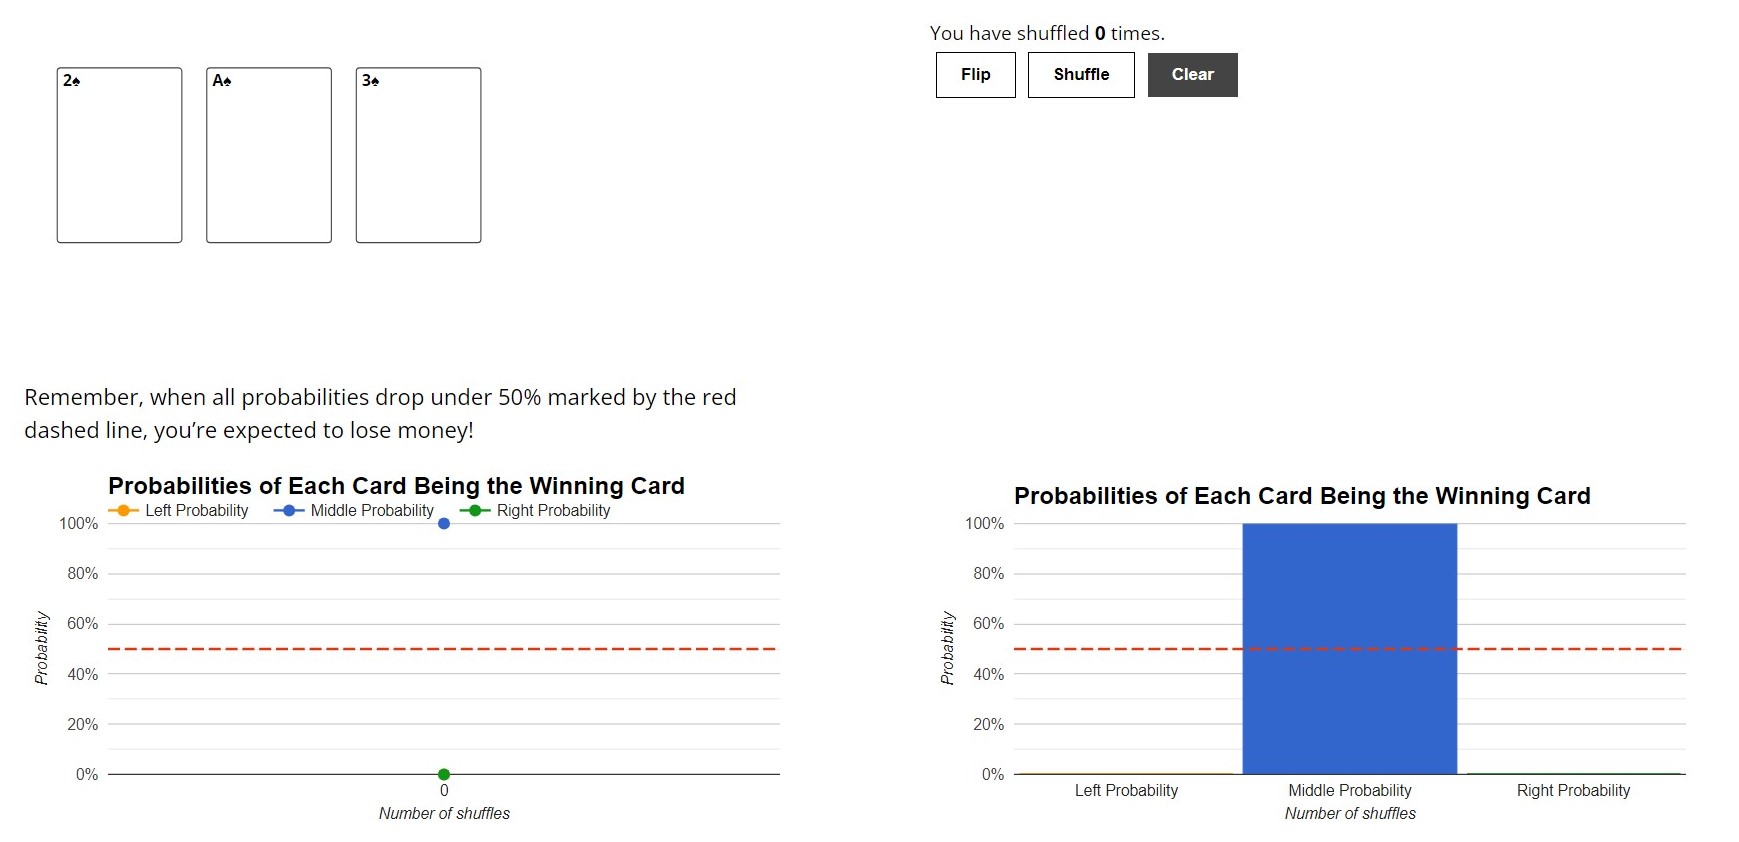
Interactive visualization of the 3-card monte
Click here for an interactive story using math to show that the 3-card monte is not really a game of skill.
Fireflies in the night sky
Fireflies sync up their flashes. Their flashes are periodic and the best way to see their behaviour is by plotting their blinks on a circle.
See how to create simulations like these in my Jupyter notebook.
A Jupyter Notebook on mathematical ecology
This notebook is a visual introduction to mathematical models used in ecology.
A gif with no explanation